


Do Less With More?
South Australia boasts as the "Vanguard" of the energy transition, generating a whopping 70% of its electricity from wind and solar with a goal of 100% by 2030. What's really going on?

South Australia has some of the best locations for Wind and Solar, and “leads the way” on renewables adoption. So what’s the catch?
Sorry, Texans: You might have a big state, but the state of South Australia (SA) is bigger. At ~380,000 sq miles (984,321 sq KM), South Australia is about the size of Texas AND New Mexico combined. Despite its size, it is sparsely populated with only 1 major city: the capital Adelaide. Roughly 1.4 million of the state’s 1.8 million residents live in or around the city.
Located in South-central Australia, the appley named state has both strong winds and lots of sunlight. SA’s coasts are located near the ‘Roaring 40s,” strong prevailing winds sweeping across 40-50 degrees latitude. The winds sweep the seas west to east and used to propel sailing ships across the Pacific. In addition, SA is very sunny. According to The Renewable Energy Atlas:
“Australia has the highest average solar radiation per square metre of any continent in the world and is a largely untapped resource with great potential. The irradiance levels at Roxby Downs in South Australia, north of Adelaide are world class and have been recorded at 2,500 kWh/m2 per annum. This resource compares directly with Spain, southern Europe, northern Africa and the Middle East.”
Because of its location, size, political leanings, very low population, strong sunlight and wind, SA is perhaps one of the very best locations to experiment with large scale wind and solar adoption.
And SA witnessed a massive transformation. On its website, the state government trumpets this change: “South Australia is at the vanguard of the global energy transition, having transformed its energy system from 1% to over 70% renewable energy in just over 20 years.” It even goes so far as to claim the state is “NUMBER ONE globally for annual renewable energy” with the goal of reaching net 100% renewable electricity by 2030.
Just look at the rapid change in just 10 years. Around 2011-2012, renewables accounted for ~ 30% and fossil fuels generated 70% of the electricity produced in the state. The state shut down its last coal plant in 2016 and now SA generates on average 70% from renewables and 30% from fossil fuels. Along the way, SA reaped praise from the World Economic Forum.

Is South Australia really a model for the energy Transition? What exactly is going on?
Just One Thing Before We Start
Tasmania, the Island off the Southern coast, generates roughly 99% of its power from renewables. But, before the greens march off on an Earth Victory Day parade, it’s important to point out Tasmania isn’t an example of an energy transition as much as it is PR and marketing. For generations, Tasmania has been home to a wealth of hydro-power resources. The Island has dozens of hydro-plants and dams. Today, 85% of Tasmania’s electricity is generated from hydro.
Outside of Tasmania, South Australia produces the most from renewables in Australia.
System Thinking
“A system is never the sum of its parts; it’s the product of their interaction.” - Russell Ackoff.
Intuitively, we understand this when it comes to cars. All of a car’s parts are supposed to work together as a system. If you Willy-nilly mix and match parts, it won’t work as well. Suppose you swap out the 4 tires currently on your car for a random assortment of an old-fashioned wooden wagon wheel, a couple of shopping cart wheels, and a bicycle tire, you’d make a silly looking Frankenstein of a car that probably wouldn’t work well - unless your goal is to get a lot of attention.
It’s the same with an electric grid: it’s a system- one giant machine really- that’s made up of a myriad of smaller machines and parts. It all has to work together. Unfortunately, this basic truism seems to be lost in the conversation around the so-called energy transition.
Not all power sources are equal: you can’t just rip some out and plug in others without risking destroying the stability of the grid, in much the same way if you put a random mix of wrong sized tires on your car.
SA Depends on its Neighboring States, including Victoria with a large fleet of coal plants
First, SA is not a standalone island, cut off from the rest of Australia. SA is part of a much larger grid, the National Electricity Market, covering the eastern and southern part of Australia with roughly 90% of Australia’s population. The NEM includes Victoria, home to the coal fields and coal plants of the Latrobe Valley. South Australia is one of the least populated areas and has the lowest population density of the NEM market.
Because Australia is a vast continent, the NEM is not connected to the Northern Territories or to Western Australia (covered by WEM).
ON average, SA relies on imports for 5% of its net power. However, that’s an average and changes rapidly based on wind/ solar conditions. For example, early in the morning of Nov 9, (its springtime in Australia), SA relied on its neighbors for roughly 30% of its power needs, and consequently, large scale transmission connections to the more populated areas of the NEM.
Capacity Utilization: A Staggering Amount Of Hardware
Wind and solar are, so to speak, the ‘fuels’ that run wind turbines and solar panels. Wind and solar are very diluted, intermittent, and highly unorganized sources of power. (In physics terms, in a state of high entropy). There’s a simple rule: the more unorganized and diluted energy is, the less useful it is to generate power. It takes massive amounts of equipment to convert those poor-quality fuels into an organized, controlled, and concentrated power that is useful for modern society.
In the past, society advanced as it chased more concentrated and higher quality ‘fuels.’ Human progress marched forward as we moved from just relying on sunlight for warmth to wood for fire. Then, we figured out how to use the more energy dense coal, then oil & gas, and then finally nuclear. Now, we’re going in reverse, chasing lower and less dense forms of energy to create power. To achieve this, we’re relying on massive amounts of amounts of expensive technology to compensate for the underlying poor quality ‘fuels.’
To get to such high penetration of wind and solar, South Australia built massive amounts of generating capacity, installing 5 MW of capacity for every 1 MW of average power generated.

When solar and wind peak, they flood the grid and can temporarily displace other power stations. For example, on Saturday Sep 24, 2023, at 1:30PM, statewide power demand was ~ 1417 MWs. However, Solar (rooftop especially) generated 98.5% of the state’s demand with the rest of the state’s power stations supplying only 21 MW of power. But that happened on a sunny weekend when grid demand was only ~ 50% of its peak demand.
Using weekly data from the AEMO (Australian Energy Market Operator), in the past 12 months, SA’s weekly mix varied from 59% gas generation for the week of May 6-13 2023 to a low of 9% gas power for the week of Dec 3-10 2022.
The impact grid wide (NEM) is similar. During a low (in Australia’s winter), renewables including hydro generated 18.6% on July 4. But on October 24, 2023, grid wide renewables accounted for 72.1% of generation.
Voltage Accordion
The Accordion effect is much like following a car with erratic speeds. Imagine you’re trying to follow a car on the highway and the car ahead of you quickly speeds up, then suddenly brakes very hard. And does this over and over and over. It makes it difficult to follow behind it.
It's not much different with the grid: wind and solar are the erratic drivers and the rest of the grid follows behind, not only to match demand but also to keep the voltage fairly stable.
Again, this is another example of system challenges. If you rapidly reduce demand for a short period of time because you’ve got a lot of rooftop solar, you don’t need as much power on the transmission lines. Transmission lines are a bit like a network of garden hoses. If you rapidly reduce the amount of water flowing through the hose, how do you keep the pressure constant? During rapid increase in solar output, the NEM market operators have literally shut down a transmission line to keep the rest of the system voltage from dropping too low. But as soon as the demand changed, the transmission line had to be ‘repowered’ all while keeping the voltage “pressure” on the grid stable.
MW Accordion & Roller Coaster Prices
Not only do you have a voltage accordion, it’s also a similar story with matching supply and demand. Wind and solar flood the grid and then drop off when the weather changes.
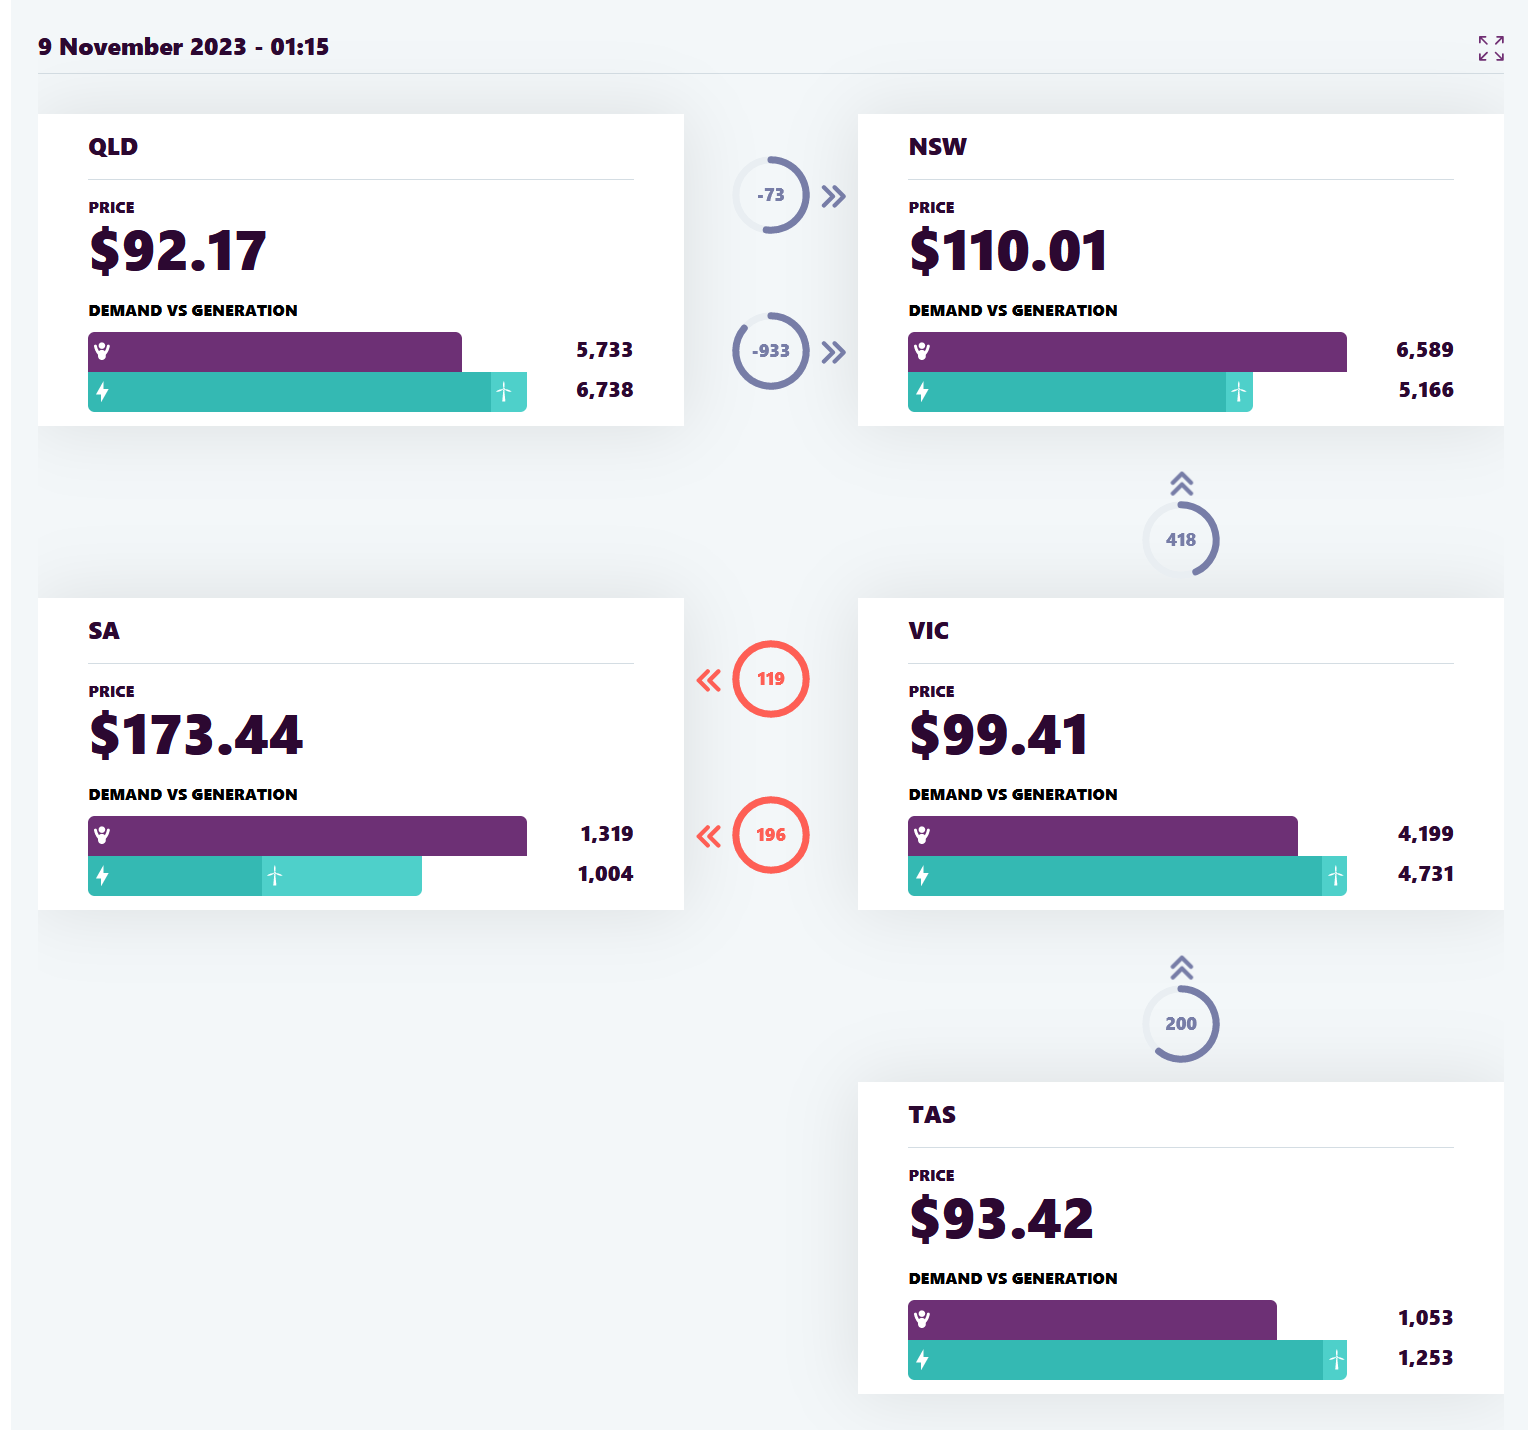
Here’s a look at the power traded between different states in the NEM on Nov 11, 2023.

Yes, you’re reading that right: prices go negative on the Australian grid. And it happens a lot. This doesn’t mean that all producers pay negative prices, some are hedged with swaps, derivatives, etc, and some are paid to keep spinning to maintain grid frequency. But just like any commodity market, the price is set by the last MW to enter the market.
The AEMO reported that in SA, negative prices occurred 18.5% of the time. Prices above $300/MW also increased to 8.4% of the time, up from just 0.5% of time in 2020-21. The AEMO stated that negative “spot prices in the -$50 to -$35/MWh range, close to the value of a Large Generation Certificate (LGC) increased substantially.”
That’s very important. Put a pin in that, we’ll circle back to it in a moment.
The AEMO also admits negative pricing is due in large part to a rapid increase in rooftop solar while sounding very ‘diplomatic:’
“Parallel with the increase in the number of rooftop solar panel systems installed on Australian dwellings, occurrences of negative spot prices in the NEM have become more prevalent.”
In a healthy market, frequent negative prices can signal a bubble: a massive oversupply of renewables. Also - all other things being equal- each new renewable installed is worth less than the one before it. As more and more renewables enter the market, prices go negative, meaning renewables have to curtail more often, resulting in declining marginal values for new renewable projects.
While SA has on paper enough gas plants to cover ~ 90%+ of its peak demand, many of those machines are older plants more suited for an era of stable power production. In a rapidly changing grid with frequent negative prices, the AEMO anticipates closure of nearly 780 MW of gas capacity by 2026, nearly 30% of the SA’s gas capacity.
And it hasn’t been smooth sailing. Following state-wide blackouts in 2016 after tornadoes knocked out transmission lines, South Australian was forced to bring back online a partially mothballed gas plant at Pelican Point. For reference, Pelican Point is located near the heart of the state’s capital and doesn’t require vulnerable long-distance transmission lines that can get knocked out.
In addition, AGL Energy invested in a 210 MW rapid response power station: Barker Inlet gas plant. Commission in 2019, the plant consists of 12 Wärtsilä dual-fuel reciprocating engines and can ramp up to full capacity in 5 minutes. This plant alone is capable of 5-10% the entire state’s typical peak load and with multi-fuel capacity and helps insure grid stability.
If you don’t have it, you can’t use it. While typically you might be able to use transmission lines to get power from your neighbors when your wind turbines aren’t turning, that assumes your transmission lines are up and running. For good reason, Barker Inlet is located close to the state’s capital with nearly 77% of the state’s population.
Follow the Money! It’s Not Just About Electricity Anymore
“Show me the incentives, and I’ll show you the outcomes…” - Charlie Munger wisely said.
So far, we’ve mostly talked about the price of electricity, but that’s only part of the story. Selling electricity isn’t the only thing power companies generate: Nowadays subsidy certificates are big money.
In the early 2000s, the Australian Commonweath government introduced the Mandatory Renewable Energy Target and certificate Scheme. “Under the scheme, RET-liable entities must purchase a specified percentage of their electricity from renewable sources each year.” The law mandated and funded a 20% renewables adoption target.
The scheme created a nationwide hidden ‘tax’ on consumers. Once a large-scale renewable project gets certified, it can sell its certificates on the marketplace (Large Generation Certificates). The law forced electricity retailers to buy certificates to meet the legal mandates, raising rates nationwide.
As of November 2023, certificate traded around A$49.50/ MWhr (US $31.80; UK £25.83). However, during the peak ramp up when renewable generation played catch up to the government mandates, prices surged as high as $75 - $90/ MW (~US 48 - 58 or ~UK £ 31 - 47) during the 2016–2017 time frame.
And South Australia took full advantage of this nationwide scheme, encouraging renewable investment and underwriting renewable power for the state supply contract(s).
This means that SA disproportionally built out renewables paid for in part by customers all around the Commonwealth. With about 7% of the nation’s population, SA generates 21.8% of the nation’s wind power. Nationwide, wind generates an average 12.8% of the electricity mix, but in SA, it provides on average 41% of the power mix.
And if you’re a wind farm developer, and you put in a 3 MW turbine, in theory you can earn A$500,000 a year per turbine, just from the RET subsidy alone… at current market rates. This also means when there’s a lot of wind, you can flood the electricity market and bid prices negative (pay people to take electricity).
Because of the RET scheme, consumers all over Australia are forced to pay extra to fund a green energy experiment that is disproportionally concentrated in South Australia.
The cost of SA’s experiment - in a state with a low population- has been funded by a much larger pool of ratepayers. If you want to scale up that experiment nationwide, who’s going to pay for it?
Other Handouts
In addition to the RET scheme, there are other incentives that we don’t have time to get into detail, but they include state subsidies, a scheme of rebates and payments for rooftop solar, and grants from the Australian Renewable Energy Agency, etc.
Plus, Australia has a “Green Bank,” the CEFC (Clean Energy Finance Corporation) backed by A$30 billion government funds for loans and ‘investments’ in renewables, offering preferred treatment for green projects that likely would not get the same funding in competitive markets.
And even more handouts… Recently, the Commonwealth government cranked out another lifeline: $25Billion budget expenditures for green projects, which is roughly 1% of its GDP.
To utilize the intermittent flood of renewables, the Australian government is doubling down, paying millions to try and jump start a renewable hydrogen program that we highlighted here in a recent post: 170 Days TO Run A Refrigerator. Ironically, the green energy ‘transition’ needs more subsidies, since the last round didn’t jump-start cheap, sustainable energy. So, it’s subsidies to make up for other subsidies.
RED FLAGS
But is it financially sustainable? The Scheme expires in 2030 and Australia already met its RET target, so any more build out will flood the market of RETS, potentially reducing the RET scheme revenue for renewables, and cutting out the major financial reason for the rapid build out.
Second, negative prices are a massive red flag. Without other mandates and subsidies, there’s not much reason for a company to spend millions and have to pay for people to take its product. So if prices turn negative, you have to curtail output. This reduces the capacity factor and revenue from the RETs and means that additional renewables projects are less valuable than projects already online- all other things being equal.

In South Australia, the massive build out of renewables highlights the massive amount of infrastructure needed to achieve 70% renewables penetration. Even with that massive build out, South Australia is still dependent on its neighboring states, and it’s build out is heavily dependent on subsidies collected from around the nation and disproportionally concentrated in one of the least populated areas of the grid. And to make up for he wasted energy created by mandates and subsidies, the Australian government is throwing more subsidies to fix the problem created, in large part, by other subsidies.
The old mantra of ‘Do More with Less” doesn’t apply here at all. It’s quite the opposite. For the South Australian Renewable Transition, it’s become “Do Less While using far more material, as long as someone else pays for it, and only if someone else will give you power when you need it.”
As Always, Thanks for Reading!
Excellent long form article and well researched.
I found it interesting that SA allowed the build of a fossil fueled power plant in 2019 ( & "un-mothball" Pelican Point) to cover for the failure of renewables reliability/intermittency. They were also sited near dense population (avoiding long transmission line issues).
Don't those two things amount to a tacit admission that:
1. the pursuit of 100% renewables is not feasible with current technology so the gov't acquiesced and allowed a long-life fossil fuel generator to be built. Or was this plant permitted in the first place so as to get in front of the other grid operators rebelling against their customer's forced subsidies of the SA grid.
and 2. public health considerations are not part of the decision tree as to where to site/operate fossil fuel generation plants. ("we can hide that as it's a different line item in the state budget"). I guess it's the same as Kenyans cooking indoors by burning wood/dung - knowing it's a health hazard but you have to eat!
It appears Australia is getting caught in the same doom loop as Germany. They are so far down the rabbit hole (in terms of face-saving and cost) that they feel they can only double down on a strategy that they intuitively (cravenly?) know will end badly.
Just shows how strong the green environmental lobbies are worldwide as they continue to gather funding at an accelerated pace.
I rue the day that Al Gore figured out that fear was a growth industry.
Great article!
Too bad the panels and turbines will have to be torn out and sent to the dump in 15 to 20 years.😖