

Germany's Rube Goldberg Machine
Germany's Rube Goldberg Machine
Germany's grid has become increasingly less efficient as it has adopted more wind and solar. In 2002, it had 2MW of generators for every 1MWh (average) of power produced. Now, it's 5 to 1.

Rube Goldberg (1883-1970) was an American cartoonist, famous for drawing overly complicated machines to preform very simple tasks. One such machine is this “self-operating napkin” cartoon (courtesy of Wikipedia). In the cartoon, the man can’t just pick up the napkin and wipe his face. Instead, he’s got a 13-step process involving a bird and a rocket to get the job done.
.gif)
It all starts when the man decides it’s time to pull the string at “A.” This launches a chain reaction to feed the bird “E,” causing it to jump, spilling G into a bucket “H,”which eventually results in a rocket launch “K” pulling a scythe that severs a cord, releasing the pendulum to swing a napkin across his face.

Perhaps the best part of the cartoon is that the diner is dressed to the 9s, apparently at a plush dining establishment. Just because one has the wealth and luxury to waste it doesn’t make them smart - but it can boost a superfluous sense of self-appointed sophistication.
Because of his cartoons, Rube Goldberg’s name is associated with machines and processes that make things ridiculously complicated.
While renewable advocates often talk about how efficient electricity is and why we should electrify everything, it’s just part of the story. Yes, electricity is a wonderful thing. For example, we’ve used electricity to power our rail networks for years as most diesel locomotives actually use electric motors to turn the wheels. The question is how to source the electricity. For the diesel locomotive, the combustion engine provides the power to generate the electricity and the diesel provides the high-density store of energy for that generator.
But when you zoom out from just the end use and consider everything upstream- from the generation sources to the materials needed to build those generators - it gets a lot more complex and far less efficient in terms of materials uses if you try to use renewables to generate that electricity.
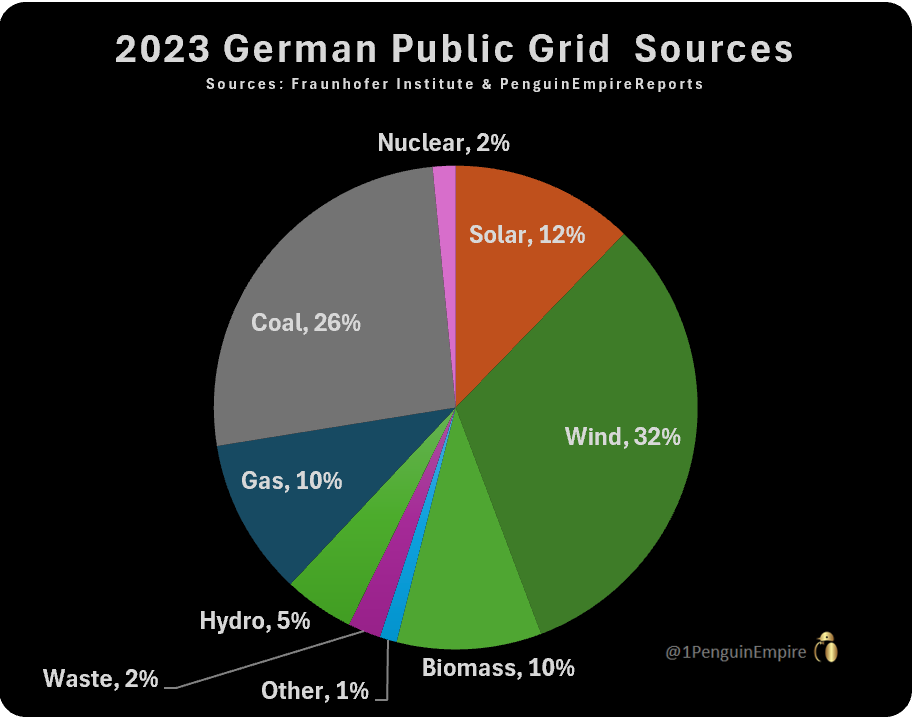
With that in mind, let’s take a trip over to Germany to see how its energy transition is coming along. According to data from the Fraunhofer Institute, in 2023 Germany generated roughly 60% of its public grid electricity from renewables. When you break it down by source, wind accounts for ~32% and solar ~12%. The rest of the renewables come from sources such as hydro (~5%) and biomass (~10%).
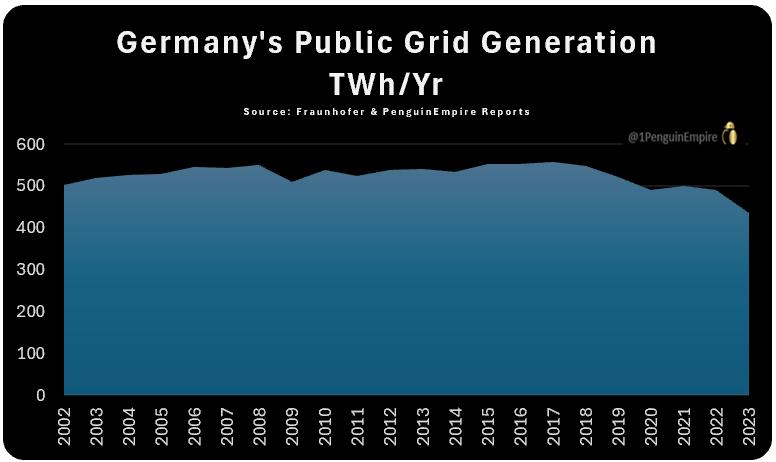
Yet while the grid has shifted towards renewables, over time Germany’s public grid electricity generation has declined by ~ 121THhrs or 21%. In 2017 German’s public grid produced ~558TWh of electricity but by 2023, it was only generating ~437TWh. While individual rooftop solar (and other self-consuming solar generation) did contribute to the decline, it only accounts for about 6.4 TWhrs of the demand.
While the public grid can supply industrial use, it does not include ‘private,’ non-grid generation at large industrial plants. For example, it doesn’t include the natural-gas electricity generation at a fertilizer plant if that electricity is used to run that plant. In 2023, natural gas ‘only’ provided 46 TWh of electricity for the public grid. But industrial ‘private’ electrical generation from natural gas was another ~26TWhrs. And this makes sense, given how much Germany’s heavy industrial base was designed to rely on cheap natural gas and not designed to rely on intermittent wind and solar.
While Germany’s grid generation flat-lined and then declined, Germany spent gobs of money installing new renewables such as wind and solar (this figure excludes biomass). But, hydro capacity remained relatively small. In 2023, Germany was home to about 5GW of hydro but nearly 150GW of wind and solar.

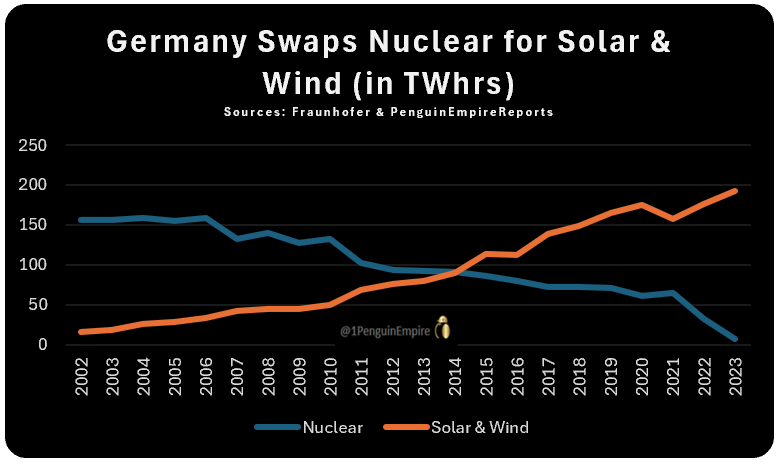
Yet despite this vast buildout, Germany largely only swapped power sources, shifting a large part of the grid from nuclear to wind and solar. In 2002, nuclear generated nearly 156 TWhrs of electricity or 31% of the public grid. Nuclear generation peaked around 2004-2006 with ~154-158TWhrs each year.
But a large part of Germany’s energy transition hinged on switching to renewables, all while using natural gas as a cheap ‘bridge fuel.’ It took until 2019 for wind and solar generation to reach 162TWhrs of generation, before dropping slightly.
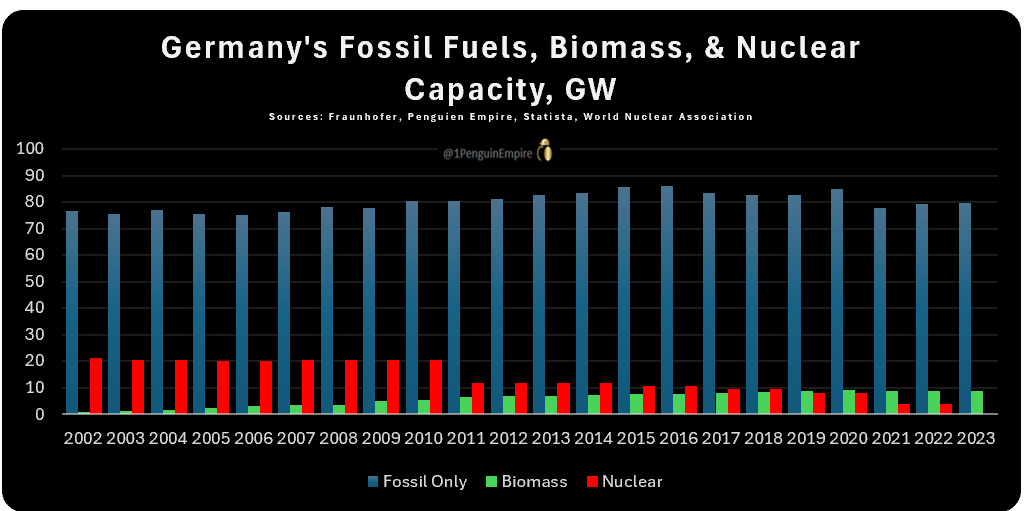
Perhaps more surprisingly, Germany’s fossil fuel fleet remained basically unchanged over this transition. In 2002, Germany had roughly 76GW of installed fossil fuel capacity. By 2023, it had ~80GW of installed capacity.
Meanwhile, Germany closed down its 21GW fleet of nuclear plants while bringing online approximately 9GW of biomass plants. If you add up Germany’s nuclear, biomass, and fossil fuel capacity, in 2002 they had approx. 99 GW of capacity. By 2023, they had ~89 GW.
In fact, Germany’s biomass plants are among its most heavily utilized ‘renewables’ plants. While these plants might burn ‘biomass,’ they operate similar to a traditional fossil fuel plant. They often have the ability to ramp up and down because their fuel isn’t dependent on if the sun is shining or if the wind is blowing. So, they provide more reliability value than weather dependent wind and solar.
There’s a big difference between capacity ratings and utilization rates. A generator might have 1MW of capacity, but it doesn’t mean it’s producing 1MWhr of power (each hour). We can capture how much of a plant’s capacity is used by comparing the average output to the rated capacity.
Intermittent renewables such as wind and solar are at the mercy of the weather and to a lesser extent, how congested the grid is. At an ideal point and time with perfect wind, a wind turbine could produce at ~ 100% of its capacity. But since wind fluctuates so much, on average, a wind turbine produces at a far lower capacity. It’s a similar story with solar.
On the other hand, fossil fuel plants, nuclear, biomass, and hydro (to a certain extent) can be turned up or down as long as they have fuel. So, they are not nearly as dependent on the weather and could have higher utilization rates. However, as wind and solar are added to the grid, they take priority over the fossil fuel plants, forcing them to be used at a significantly lower capacity.
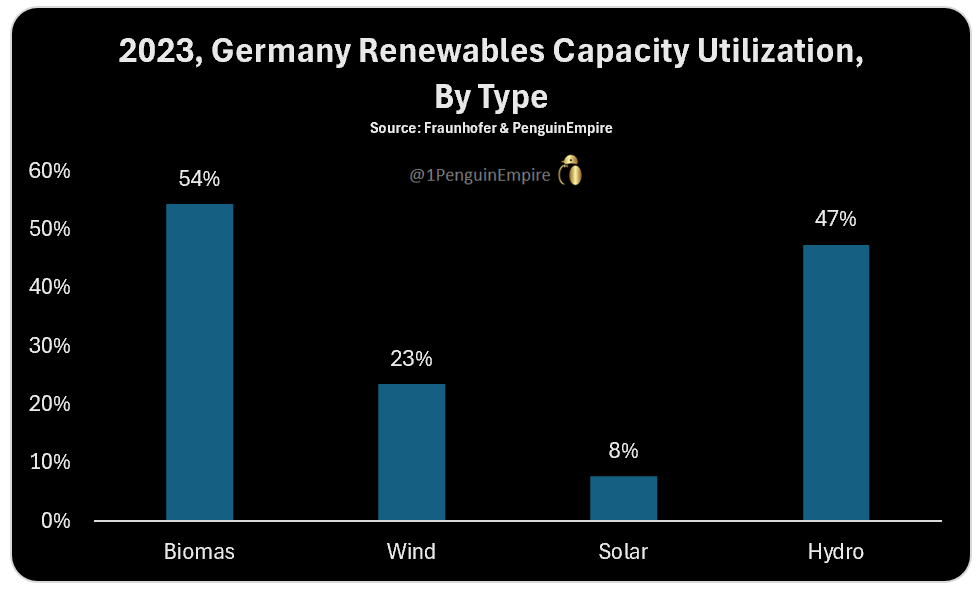
Let’s look at the capacity utilization rates for renewables in Germany. With just about 9GW of capacity, biomass produced ~10% of Germany’s electricity in 2023. Wind and solar has roughly 150GW of installed capacity and only produced ~44% of the electricity. On average, the biomass plants ran at 54%. But solar was dismal: if you had 100 solar panels, on average they produced the rated output of just 8 panels.
And that brings us back to the starting point, because wind and solar are intermittent, they need vast amounts of backup generation. In essence, if you want to build a reliable grid based on wind and solar, you end up building 2 grids: the wind and solar grid, and the backup grid.
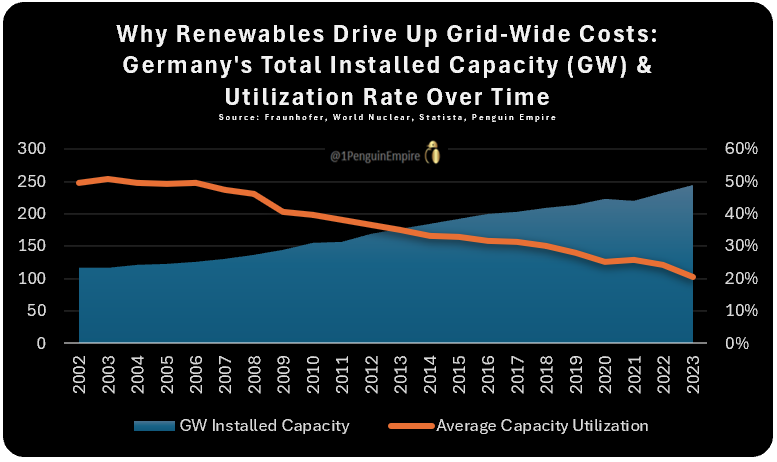
Between 2002 and 2023, Germany has more than doubled the capacity size of its grid. In 2002, its total generating capacity was approximately 116GW. Yet by 2023, its capacity was ~245GW, with ~150GW of wind and solar. But during this time, Germany’s electricity grid production declined by ~21%.
So what does this mean? Germany’s capacity utilization dropped. In 2002 for every 1MWh of power produced (on average), there were 2MW of installed capacity. But by 2023, for 1MWh of electricity produced on average, there was 5MW of generators installed!
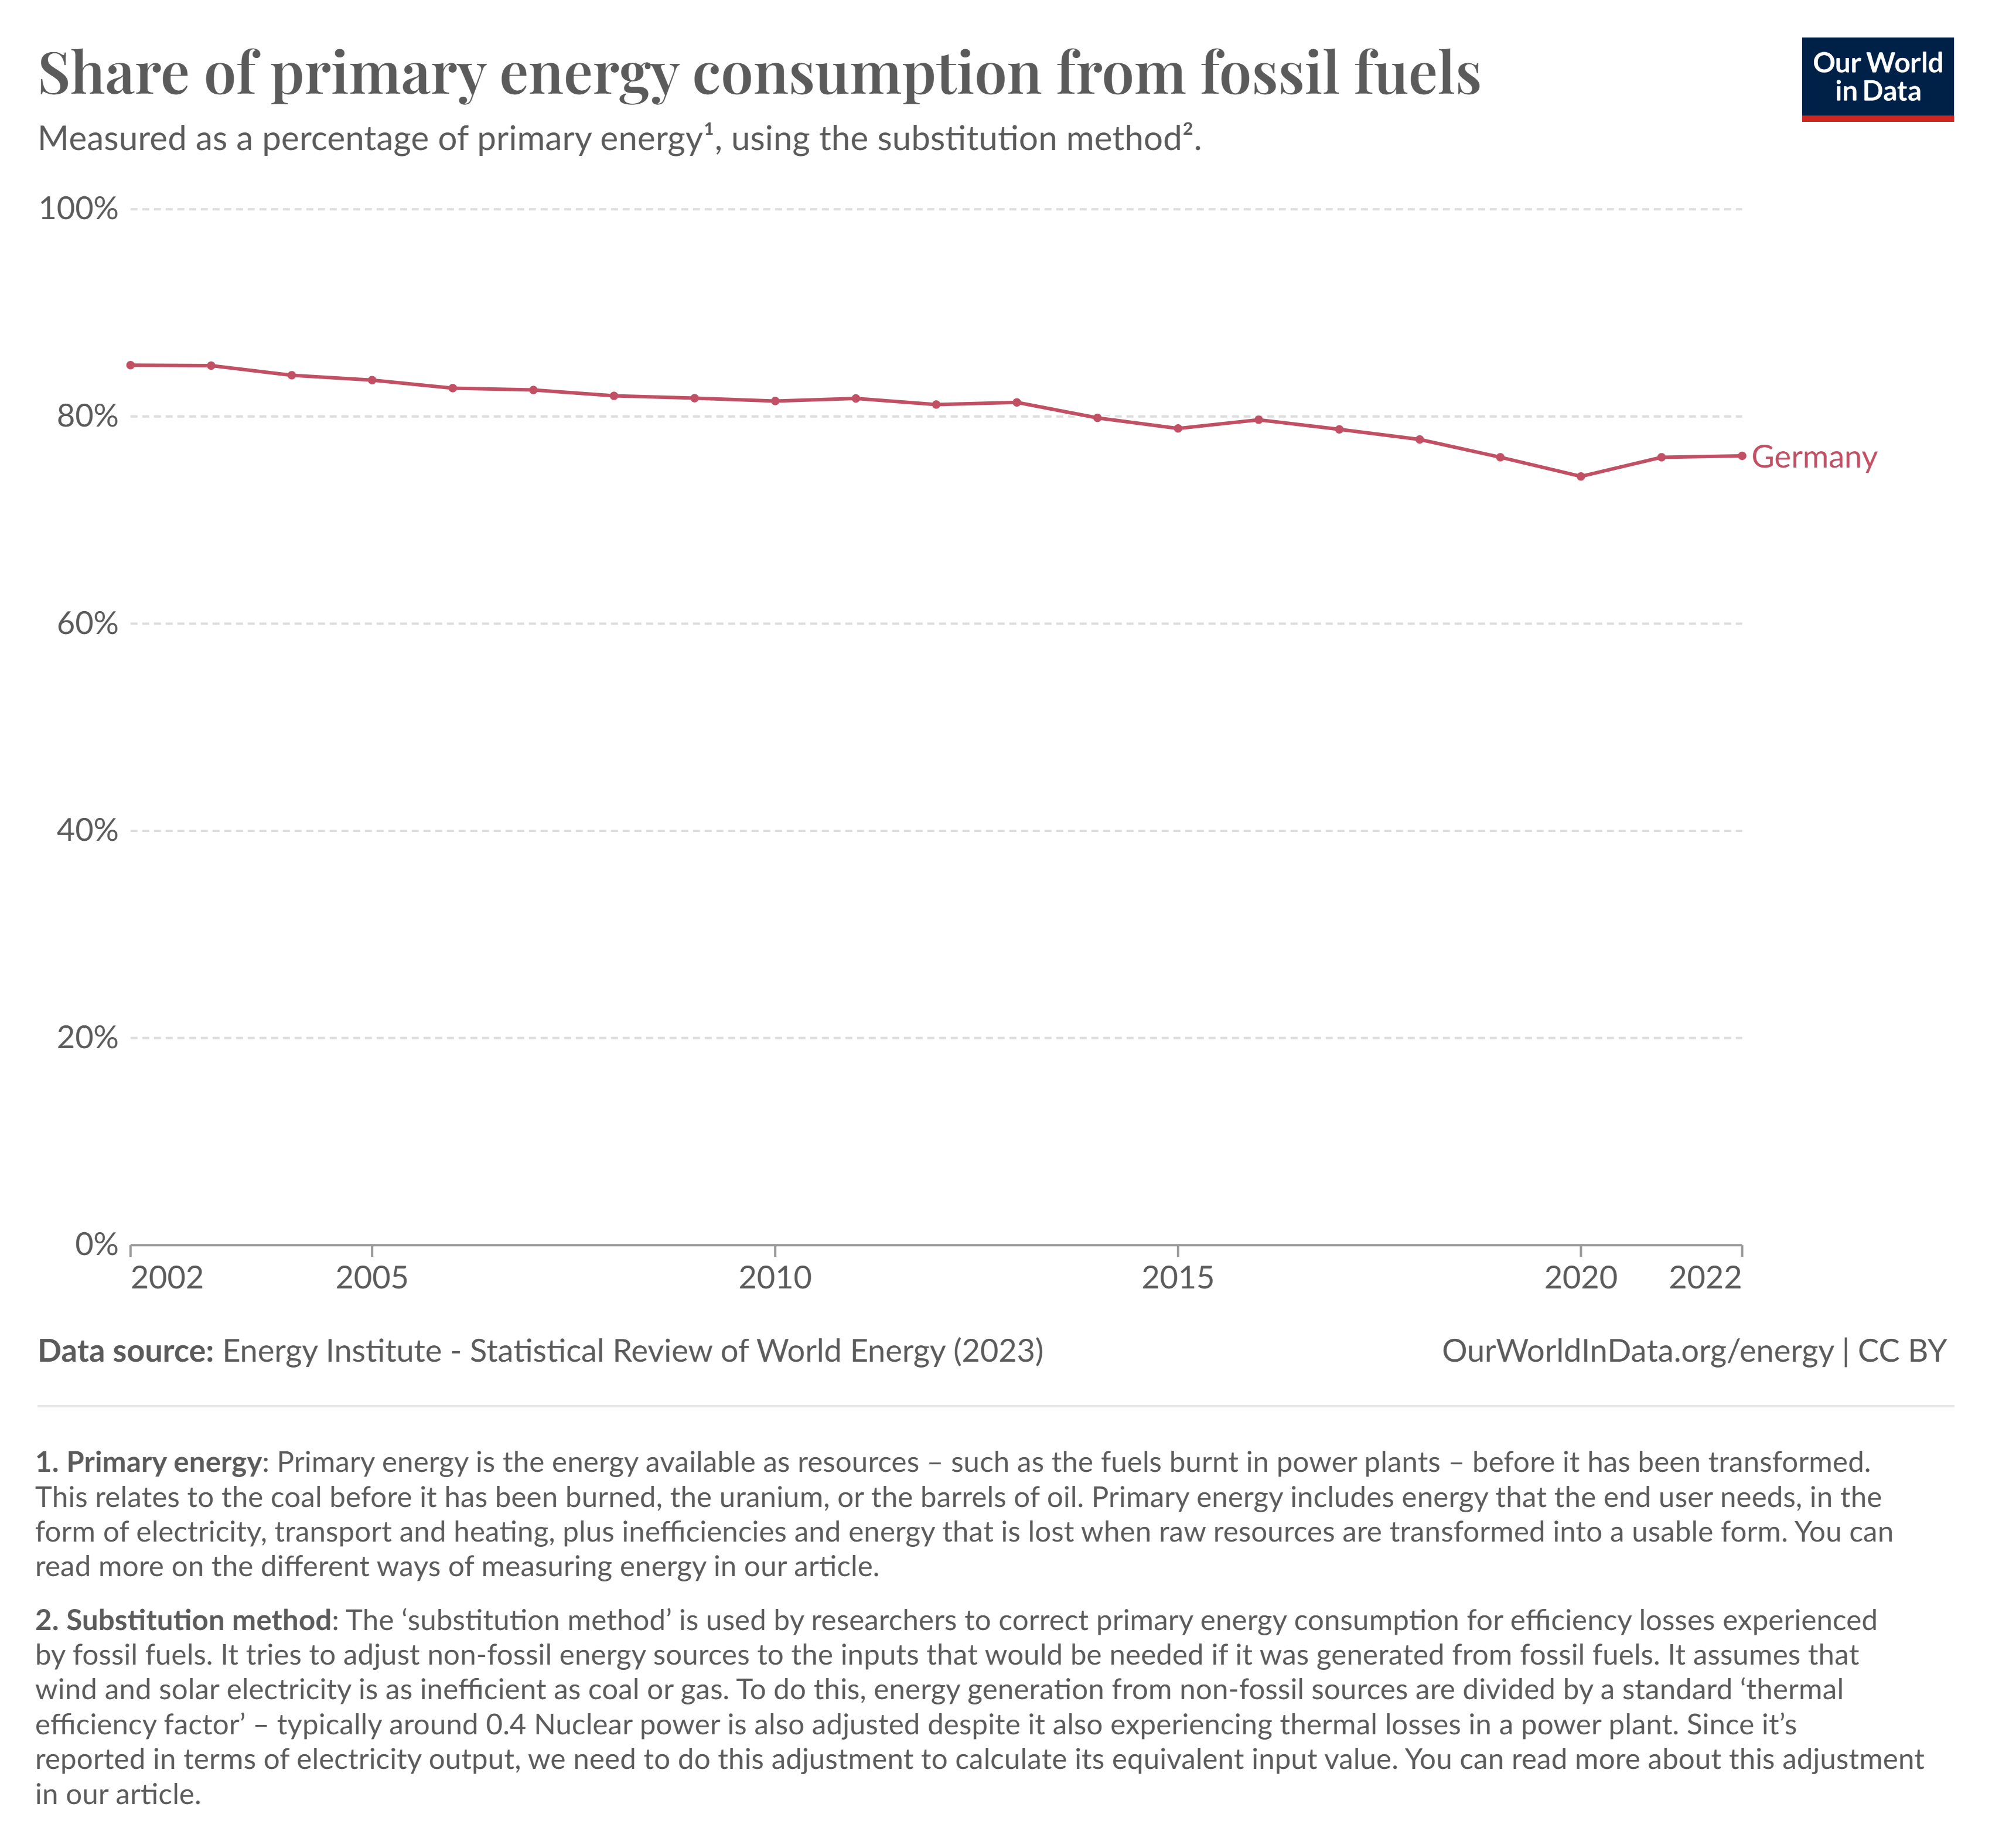
We’ll look at one last chart: Germany’s fossil fuel consumption over time. This includes all fossil fuel uses, from driving, heating, industrial use, and electrical generation. Despite more than doubling its electrical grid, pouring billions into the transition, Germany has only managed to reduce its fossil fuel use from 85% to 76% of its total energy consumption.
An approximately 9% change for all that ‘investment.’
Does that sound like an excellent return on investment?
When it comes to a renewable-based grid, it takes a vast amount of overbuilding to insure a reliable grid. But when you overbuild that much wind and solar, there are times when the grid cannot handle that much output on a sunny, windy day, resulting in wind and solar being curtailed.
The deeper into the energy transition Germany goes, its grid is becoming less and less efficient.
And Germany’s renewable woes aren’t unique.
As
and ,wrote in a recent piece on Minnesota’s mandated energy transition:“This “overbuilding” and curtailing vastly increases the amount of installed capacity needed on the grid to meet electricity demand during periods of low wind and solar output. The subsequent curtailment during periods of high wind and solar availability effectively lowers the capacity factor of all wind and solar facilities, which greatly increases the cost per MWh produced.”
Wasn’t ‘going green’ supposed to be about doing more with less? Apparently, going green today means the opposite: doing less while requiring vastly more resources.
As always, thanks for reading!
Nice overview of the results of Germany’s supposed Green Energy Transition.
Unfortunately, this was so predictable. I hope Germany’s manufacturing sector will survive, but I am not optimistic.
German Greenwishing itself into second class citizenship.