

Compounding Copper Demand
Compounding Copper Demand
The grid isn't built with magic: it doesn't just appear out of thin air. It isn't built with political wishes or platitudes: it has to be sourced with real, physical materials.

The “Energy Transition” has a copper problem. If we continue with this Net-Zero attempt, ‘green’ energy can compound copper demand, rapidly increasing the rate of our copper consumption. This can stretch global supply chains and slow down the pace of -or all together stop- Net Zero. In this article, we’ll look at the first piece of this problem: Compounding Copper Demand.
Let’s set the stage by talking about compounding. It’s like building a snowman. You might start with rolling a small snowball across the ground to pick up more snow. At first, it only picks up a little bit of snow. But as you keep rolling it, the snowball becomes bigger: and the bigger the snowball, the more snow it picks up because it has more area in contact with the snow on the ground. It compounds on itself until it’s too heavy to push across the yard and you have a base big enough for a snowman.
How much copper does a renewables-based grid need compared to a fossil fuel grid?
To answer that question, let’s talk about the Copper Multiplier: A renewables grid is far more ‘copper hungry’ than a fossil fuel/ nuclear grid for two reasons:
The ‘greener the grid,’ the more generators you’ll probably need to produce the same amount of electricity (on average)
…multiplied by….
Each renewable generator needs more copper per unit than fossil fuel generators.
1: The “greener the grid,” the more generators you’ll probably need.
It’s a pretty simple idea: if you want to build a grid around unreliable and hard-to-predict wind and solar, you need a lot more generators to cover the intermittent nature of… well… Mother Nature.
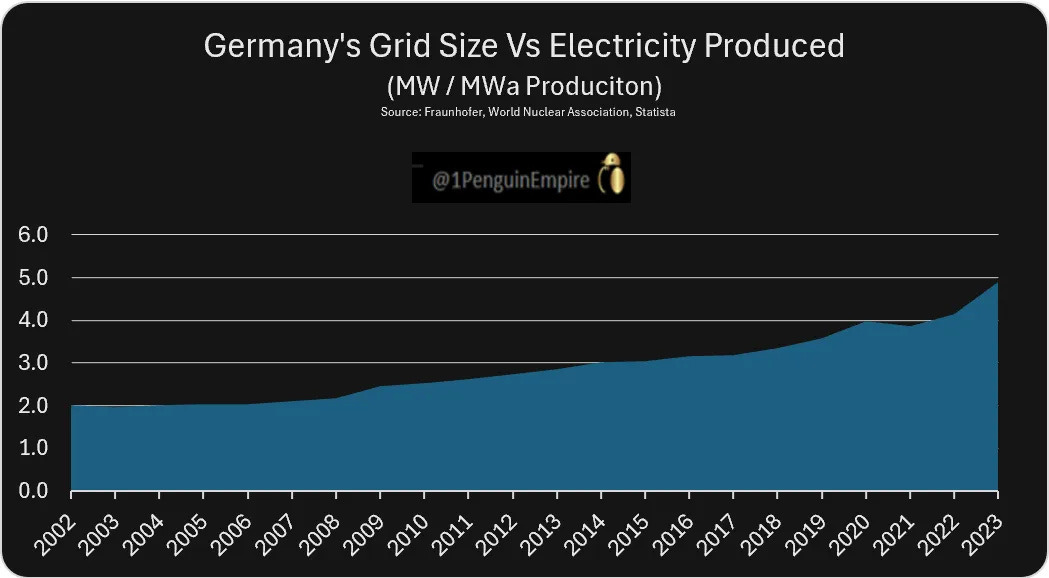
And it’s not just in theory: we’ve seen this play out in real life. PenguinEmpireReports has published two case studies on locations with ‘high’ renewables: Germany and South Australia. One key indicator is the size of the grid (MWs of generators) compared to the average amount of electricity produced (MWh/h).
Let’s put in in terms of running an airline. You’d probably want to know how many seats there are on an average flight compared to the number of tickets you sell. An empty flight is nice for elbow room, but it’s not good for the airline if it becomes a trend.

For a grid, you can think of the generators capacity (MW) as seats on a flight and the electricity demand as average tickets sold (average MWh/h).
Unlike an airline, a grid doesn’t want more demand than capacity since it could lead to blackouts. And demand varies depending on the time of day, time of year. So a grid needs to balance enough capacity for demand peaks or mechanical issues, but not so much capacity that it costs too much for the ratepayer.
Back in 2002 around the start of the Big Green Push, Germany had 2 MW of generators (airplane seats) for 1 unit of average electricity production (tickets sold or MWa). But as Germany added more renewables, its fossil fuel fleet size remained relatively unchanged. Back in 2002, Germany had ~76GWs of fossil fuel plants; in 2023, they had ~ 80GWs. This was in part to make up for the closure of Germany’s nuclear fleet but the main difference between 2002 and 2023 isn’t the size of Germany’s fossil power plant fleet: the difference is they are used less (on average).
In total, Germany generates ~45% of its electricity from wind and solar. But to reach that, Germany now has ~ 5 MWs of generators for each MWa of power produced. Back to the airline example, Germany used to have 2 seats for every 1 ticket sold: now it’s 5 seats for 1 ticket sold. But that 1 ticket sold still has to cover the cost of all of the seats (with some subsidies, no doubt).
Germany isn’t alone in overbuilding to compensate for renewables. South Australia, like Germany, has 5 MWs of generators for each average unit (MWa) of power produced. However, South Australia has a much sunnier climate and very good wind resources. Plus, it has grid connections with coal plants in nearby states, enabling South Australia to produce on average ~70% of it’s electricity from renewables.
These are real world examples of how much overbuilding occurs to reach a significant portion of renewables generation. Both required 5 generators (MW) to 1 unit of demand (average MWa). But the difference in renewables penetration is due in part to the different locations and the fact that South Australia can lean heavily on neighboring states for coal electricity when needed while Germany still uses its own coal to get through a rough patch.
2. Each renewable generator needs more copper per unit than fossil fuel generators.
Renewable generators tend to use far more copper for each unit installed than ‘traditional’ fossil or nuclear generators. Why? Because if you’re trying to gather diluted resources (such as wind or solar), you need more materials. For instance, wind farms are spread out over vast areas, meaning you need extra cables and transformers to tie together all those ‘mini’ power plants, whereas a coal plant can use ‘copper economies of scale’ and use far less copper for the amount of capacity installed.
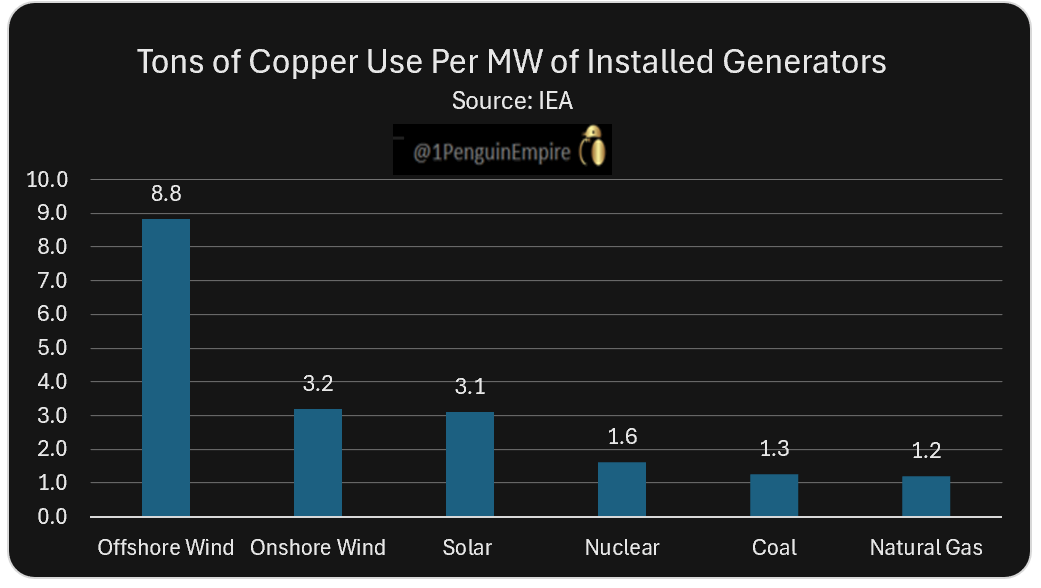
Based on data from the IEA, here is the approximate amount of copper used by various generators, per unit installed (not adjusted for capacity utilization). Offshore wind is a copper hog: requiring approximately 8.8 tons of copper while a natural gas plant might only need 1.2 tons of copper per MW of capacity.
Putting It Together.
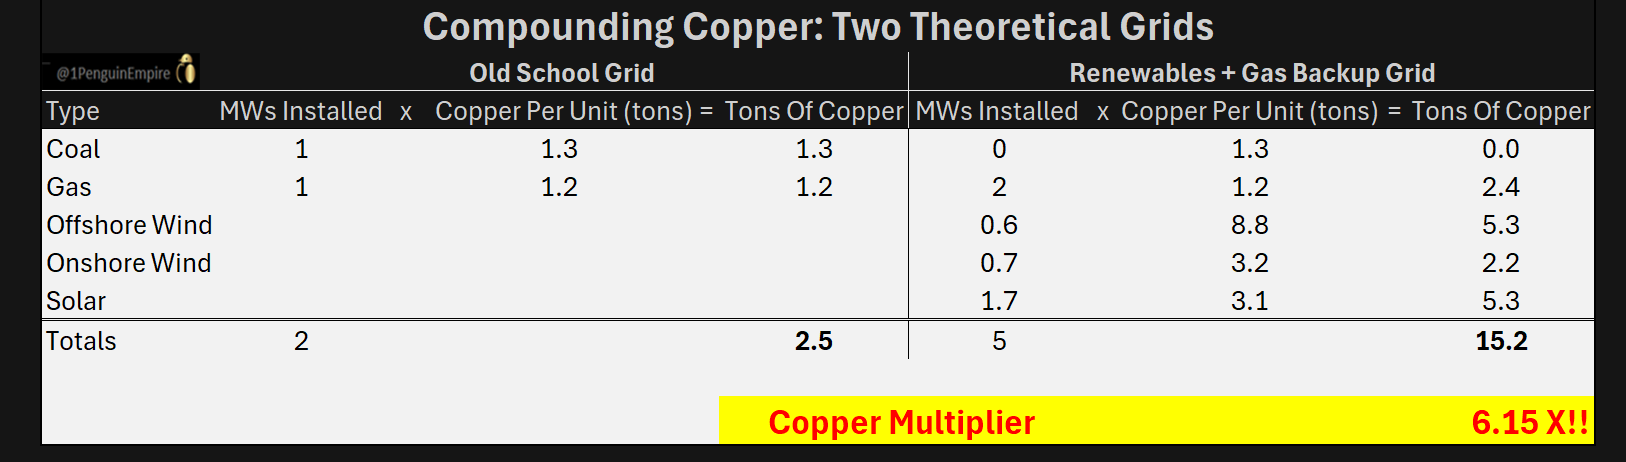
Lets’ see how this compounds copper demand by looking at two theoretical grids:
An ‘Old School Grid’ with fossil plants or nuclear. Like Germany in 2002, we’ll use roughly 2 MW of generators for each MWa of electricity produced. If you want to play with the numbers and give yourself a greater margin of error, feel free to go up to 2.5 MW to each MWa.
Peter Pan’s Neverland GridA Renewables + Gas Backup grid. Much like SA or Germany now, it has 5MWs of generators for each (average) unit of power produced. Once again, you can play with the number of renewables and pick more solar if you live in Arizona or more offshore wind if you live in Scotland or New York. But the general principle holds.
Note: this includes copper already installed. And, this only looks at copper demands of generators, not the additional long-distance transmission lines. Nor does it include additional generation needed to “ electrify everything.”
As you can see, a renewables-dominated grid needs far more generators, and each renewables generator is far more copper intensive. Combined, this means a theoretical green grid might need ~6xs times as much copper as a fossil grid per unit of electricity produced.
This does not necessarily mean that global copper demand will go up 2, 3, or 4x. There are other factors at play well beyond the scope of this article and includes China’s copper demand and if it will slow down over the next decades.
In addition, many estimates of future copper demand assume Net-Zero will happen. But here’s a different take: Net Zero is the current political flavor of the day, and political winds can change. While Net-Zero might demand more copper, the rate and price of new supply is a very different story. If copper and other ‘transition’ metals production becomes constrained, if blackouts occur because there isn’t enough reliable power generators, if prices rise high enough, and if enough people say “No Thanks,” don’t be surprised if voters revolt at the ballot box.
In closing, while specific numbers might vary, the general principle holds: a green grid needs significantly more copper than a ‘traditional’ grid. But copper doesn’t just come from your local home-improvement store: it has to get mined and refined.
And that’s a topic for an upcoming article!
As always, thanks for reading!
It has regularly been claimed that Weather-Dependent “Renewables” are substantially cheaper than the use of convention generation technologies using Fossil fuels and Nuclear technology for power generation.
https://edmhdotme.wpcomstaging.com/the-myth-of-cheap-uk-wind-power/
According to the calculations detailed here, the mandating of Weather-Dependent “Renewables”, Wind and Solar power generation, have the potential to incur very substantial costs on taxpayers in any Nation’s response to the putative Climate emergency and the imposition of radical policies to achieve “Net Zero”.
These calculations show the initial capital cost comparisons and the probable long-term excess costs, when accounting for measured “Renewables”productivity as compared with the use of Gas-firing, (for example from using locally sourced Fracked Gas), for the current UK and European fleets of Weather-Dependent “Renewables” to be roughly summarised as follows:
* in the UK capital costs are ~+130 US$ billion in capital expenditures and ~+350 US$ billion in total long-term costs.
* for the whole EU (27)+UK capital costs are ~+810 US$ billion in capital expenditures and ~+2,070 US$ billion in total long-term costs.
It's also a huge demand on aluminum. Transmission and distribution lines are traditionally aluminum, overhead lines usually have a steel core. Much of framing of the generator will also be aluminum